Get Started
Welcome to the Polkadot Wiki
The Polkadot Wiki serves as the central source of truth for Polkadot. It is a community-focused initiative led by Web3 Foundation to keep an up-to-date resource on the best information for learning about Polkadot.
For developer-focused documentation see the Polkadot Documentation.

Getting Started
What is Polkadot?
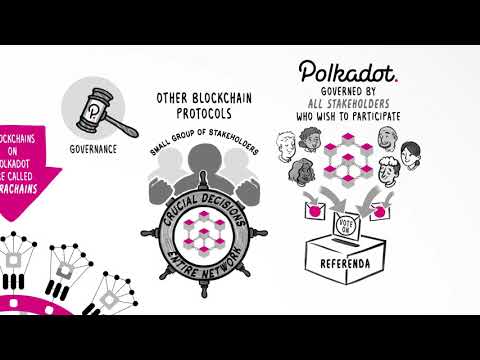
Polkadot is the first layer-0 (L0) blockchain that provides shared security and secure interoperability to layer-1 (L1) blockchains. Those L1 blockchain attached to Polkadot are also called parachains as their transactions are processed in parallel by Polkadot. For more information about Polkadot see the dedicated page about the state of Polkadot 1.0 released in mid 2023.
Polkadot has an on-chain open governance (also called Polkadot OpenGov) to orchestrate decisions, including accessing funds from the treasury.
The DOT token gives you the power to participate in Polkadot OpenGov, and staking.
The level of abstraction and generalization of Polkadot allows to build applications that are specific to their use cases, and for those applications to communicate securely leveraging each other value proposition. The trustless cooperation between applications is what makes Polkadot an ideal ecosystem to build a web3 future.
What can I do with my DOT?
DOT is the native token of the Polkadot Network. DOT can be used for transaction fees, staking, governance, acquisition of coretime and for enabling several key functionalities on Polkadot. See more information on the Chain State Values page.
Info
Explore Polkadot with a secure and user-friendly wallets listed on the Polkadot website.
DOT has utility in Polkadot's OpenGov where you can vote, delegate your voting power, and place deposits for your referenda or referenda proposed by others. DOT can also enable you to participate in programs like the Decentralized Nodes program.
Polkadot Gifts

Polkadot Gifts provide an easy way to:
- Onboard friends or family who are curious about blockchain but haven’t made the leap yet.
- Share your love of Polkadot and send any amount of DOT.
- Say ‘thank you’ or send someone tokens when you don’t know their address.
- Get friends and family set up to participate in crowdloans.
Learn more about how you can create and send Polkadot Gifts here.
Why should you use Polkadot?
Whether you're a blockchain developer or if you're interested in taking part of Polkadot's community, Polkadot offers a platform for everyone.
Where to start learning?
The Blockchain Fundamentals MOOC course is a great introduction to start familiarizing yourself with blockchain concepts such as cryptography and networks, and how these play into things like decentralization and cryptocurrency.
This is recommended for users with backgrounds of all levels, and the course is free!
Brand-New Polkadot learners
- Polkadot's original white paper is a technical summary around one possible direction of implementing the Polkadot network. This paper uses rationale and technical details to support why this direction is beneficial. This original white paper also explains how Polkadot's core components work together to build this decentralized network.
- Polkadot's light paper is a visual, easy to read, and less technical introduction into its blockchain technology. This paper dives into the components of Polkadot but is understandable for both a non-technical and technical reader.
- Polkadot's overview paper is an updated version of the white paper that describes the protocol in more technical terms. We would recommend reading this overview paper if you are interested in digging more into the protocol itself.
- The Web3 Foundation's research site contains details and up-to-date technical research on Polkadot in general, including scalability, cryptographic, economic, and security aspects of the protocol.
- Polkadot for Beginners: A non-technical guide to decentralization, blockchains & Polkadot - a book funded by the Polkadot Treasury
- Polkadot's specification is a GitHub repository that holds the latest Polkadot Host protocol specification, Polkadot's specification tests of the many components of the network, and the Polkadot Runtime specification. This repo holds algorithms and explores how various processes function in the Polkadot network. The Polkadot specification takes Polkadot's ideas and concepts from the light and the white paper but focuses on the technical specs of the technology.
- Watching the Technical Explainer Videos: These are great introductory videos that explain and demonstrate how to use Polkadot and its User Interface.
- Reading What is Polkadot? A Brief Introduction on Medium. There are also other great articles to read on Polkadot's Medium or Web3 Foundation's Medium.
- Polkadot Study is a platform where developers can write tutorials for the Polkadot ecosystem. Part of the development of the platform was funded by the Kusama treasury. The platform also hosts Substrate in Bits, a technical content series aimed at solving the pain points of developers building with Substrate and Rust.
For brand-new learners of Kusama, Polkadot's canary cousin network: To learn more about how to build and maintain on the Kusama network, please head over to our Kusama Guide.
Resources
- Polkadot Crowdcast - List of all Crowdcast webinars that the Web3 Foundation has done.
- Polkadot Explorer - Browser for the Polkadot network; can be used for Polkadot, Kusama, or any Substrate-based chain.
- Subscan.io - Explorer for Substrate based chains.
- Polkadot Overview - Dr. Gavin Wood presents an overview of Polkadot. (Video)
- Polkadot Overview - Dr. Jutta Steiner presents Polkadot. (Video)
- Polkadot & Substrate Overview - Dr. Gavin Wood presents Substrate (blockchain in-a-box + VM) and Polkadot, and builds a blockchain on-stage in 30 minutes using Substrate. (Video)
- Community / Ecosystem - List of community rooms and channels to talk to others about Polkadot.
- Contributing Guide - Rules for contributing to the wiki.
- Polkadot Knowledge Base - Troubleshooting resources for specific errors and problems.